Your trade changed. Do you still know what you own?

After a few rolls an iron condor is not an iron condor anymore. Risk Illustrator reads what the position has become and prices hold, close, and roll on one basis before you commit more capital.

SPY · demo position · defined-risk, 760 to 785 P&L in 10d · Sep 8 · model, from recorded cost basis
P&L at spot $184.18

The gap

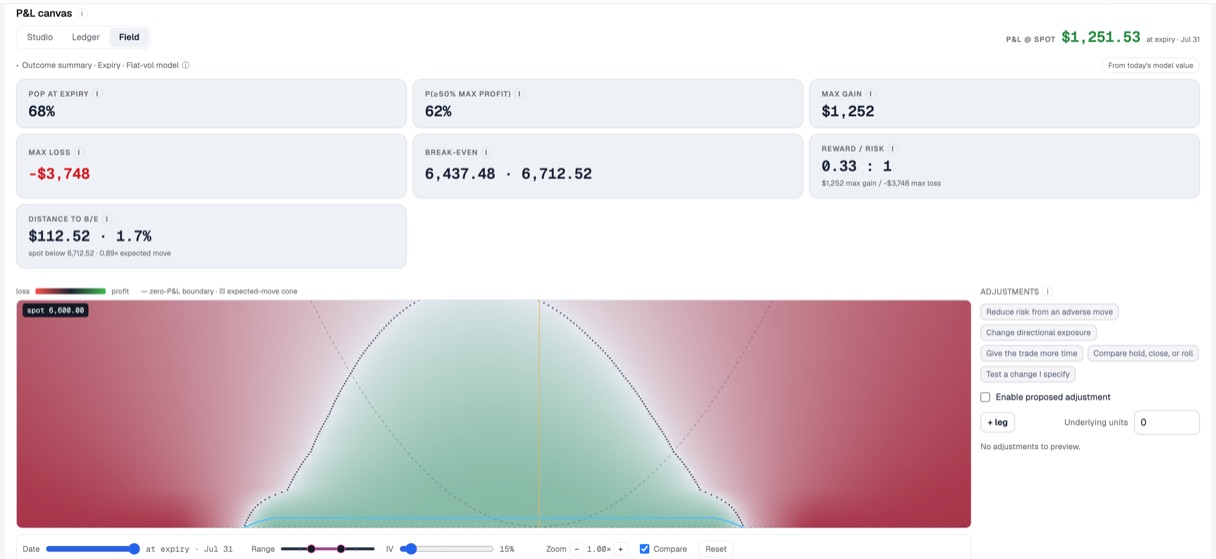
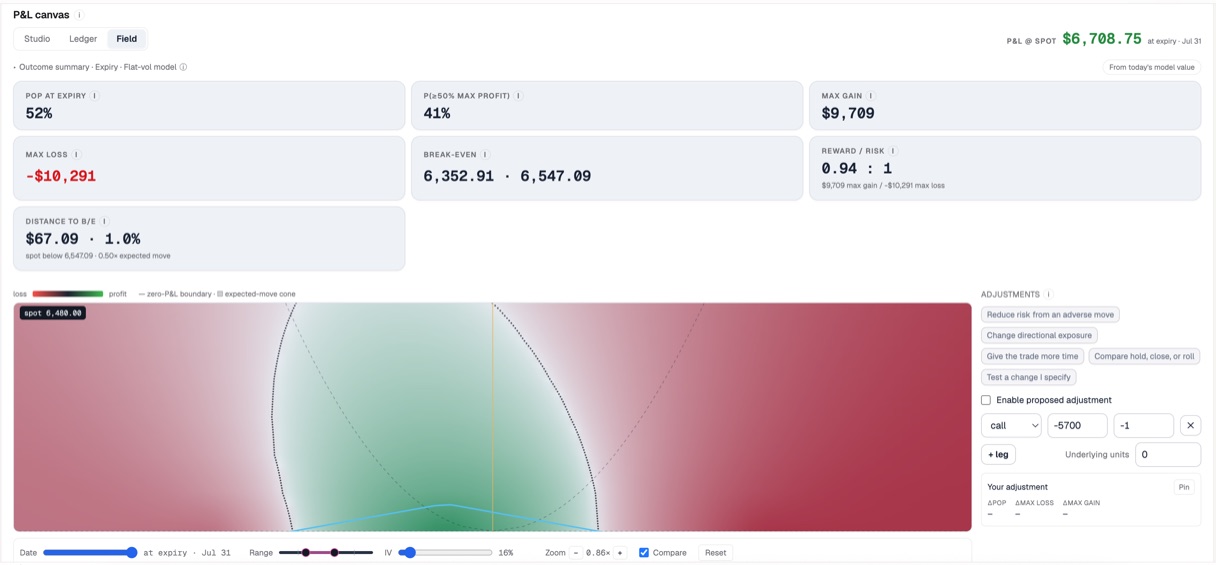
A payoff chart is where the question starts. After entry the basis moves, legs get rolled, and risk migrates between strikes. Most traders piece the answer together across five tools.

  1. Broker
  2. Payoff tool
  3. Spreadsheet
  4. Journal
  5. Back to broker

Risk Illustrator keeps the whole decision in one inspectable place.

How it works

From the position you hold to a decision you can explain.

Read the position

See what your position is actually made of.

A reading names the components inside your legs and adds them back to exactly what you hold. The X-ray states a primary risk, a tested side, and a break-even against the expected move. Legs, fills, and the reconciliation stay one click away.

Reading
1 component, 5 legs
Primary risk
−$375
Tested side
outside 763.75 to 781.25
Position X-ray for a SPY flyagonal: primary risk −$375, tested side outside 763.75 to 781.25, break-even versus expected move, a scope picker by expiration, the current reading table, and the five legs with strikes and costs.
Desk · Position X-ray

Stress the thesis

Know what breaks before the market tests it.

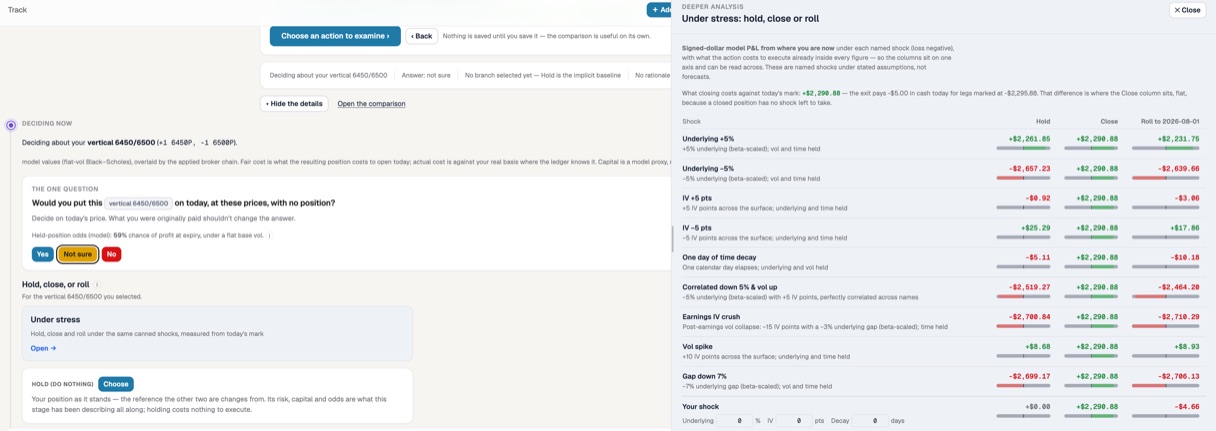
Re-price the position under named shocks: underlying ±5%, IV ±5 points, one day of decay. Read the result in signed dollars beside a plain-language briefing. Each bar states its assumption; none is a forecast.

Underlying +5%
−$396.30
IV −5 pts
+$170.90
One day of decay
+$15.18
The P&L canvas beside a Risk briefing in plain sentences and a Position stress panel listing named shocks, underlying +5% and −5%, IV +5 and −5 points, one day of time decay, each with a signed-dollar result and a button for the Greeks under that shock.
Analyze · Position stress

Compare and record

Compare the decision, not just the trade.

Hold, close, and roll are priced on one basis: cash now, execution value, booked P&L, time left, what you would then hold, the most it could then lose, and the capital it ties up. Nothing is ranked. You choose, and record why.

Every branch you weighed, chosen or passed on, is held unchanged from that moment and valued at each market checkpoint since.

A comparison table with Hold, Close, and Roll columns: what becomes of the position, cash now, execution value, P&L it books, time left, what it then holds, the most it can then lose, and capital it then ties up, beside a Record panel asking why this is the right call today.
Decide · Hold, close, roll on one basis

Whole-profile risk

Your positions make sense together.

Portfolio theta, vega, and capital roll up. Delta and gamma stay per underlying rather than summed into a number that means nothing. Then find which symbols dominate volatility and directional exposure.

Portfolio theta
$9.05 / day
Portfolio vega
−$29.95 / vol-pt
Capital required
$1,514
Portfolio risk: at-a-glance portfolio theta $9.05 per day, vega −$29.95 per vol point, capital required $1,514; three facts worth reading now for AAPL, QQQ, and SPY; and a positions-and-exposure table with per-underlying delta, gamma, theta, and vega.
Portfolio · Whole-profile risk
Risk concentration: long and short volatility concentration and signed directional dollar exposure for each underlying.
Portfolio · Concentration

Build from the chain

Build with the risk already visible.

Price, liquidity, Greeks, payoff, and model evidence move together as you select each leg across expirations. Switch to the volatility view and the same position sits on its smiles, term structure, and expected moves.

Option chain by strike across two expirations with a price heatmap, per-contract price, delta and IV, the held legs outlined, a hover dossier comparing model values to CBOE-observed values, and a preview panel with payoff, probability, capital, Greeks, and valuation evidence.
Analyze · Option chain by strike · CBOE delayed
$184.18
P&L at spot
50%
Probability of profit
1.67 : 1
Reward to risk
0.44σ
Room to break-even

Walkthrough

Five minutes, one adjustment, start to finish.

Why it’s different

Most tools help you build a trade. This one helps you understand what the trade has become.

Aspect A payoff calculator Risk Illustrator
Starts from A strategy catalog The position you already hold, basis included
Shows The expiration line Price × time × volatility, with break-evens and the expected move
Complex structures Five legs, five rows Reconciled into components that add back to what you hold
Adjusting Rebuild each alternative in a new tab Hold, close, and roll priced side by side on one basis
Portfolio One position at a time Theta, vega, capital rolled up; delta and gamma kept per underlying
Assumptions Hidden behind one number Model values labelled apart from broker marks; source and vol model shown
Afterwards Nothing Every branch you weighed, valued at each checkpoint since

For whom

For traders who have outgrown a payoff calculator.

Not for people looking for trade alerts.

A good fit

  • You manage several options positions at once.
  • You regularly roll, resize, hedge, or restructure.
  • You use spreads across strikes or expirations.
  • You want to inspect assumptions before trusting a result.
  • One avoided adjustment mistake is worth more than another generic tool.

Not the product

  • Trade signals or personalized recommendations
  • Automated execution
  • Unusual-options-flow alerts
  • A beginner options course
  • A promise of profit

Every model has assumptions. Ours are meant to be seen.

  • Model values labelled apart from broker marks
  • Read-only broker integration where available
  • Shareable, frozen analysis snapshots
  • Decision support, not investment advice

Closed beta · US-listed options

Know what changes before you change the trade.

We’re inviting a small group of active options traders to shape the adjustment workflow. Tell us how you trade and we’ll contact the best-fit participants first. No card required.

By joining, you agree to receive product and beta-access emails. Unsubscribe anytime.

Before you join

Clear answers.

Is Risk Illustrator a trading signal service?

No. It explains current risk and compares user-directed choices. The trader decides.

Who is the beta for?

Active self-directed traders who understand basic options and regularly manage multi-leg positions or adjustments.

Does it place trades?

No. The current product focuses on analysis, read-only imports where available, and decision records.

Which products does it support?

The beta is built for US-listed, USD-denominated options positions. Broader market support is not yet promised.

How is this different from a payoff calculator?

It connects position decomposition, named-shock stress, adjustment comparison, lifecycle accounting, and portfolio context in one workflow, and keeps the model’s assumptions visible at each step.

When will access open?

Access is offered in small cohorts. Waitlist members are contacted as places open.