The broken wing butterfly has a dirty secret, and it's also the key to adjusting one: a BWB is not really a butterfly. It's a clean, symmetric butterfly with a directional tail welded onto the broken side. Risk Illustrator's structure engine says it in exactly those terms — "a butterfly with unequal wings — the asymmetry splits into a clean fly plus a directional tail."
Traders who adjust BWBs badly adjust "the butterfly." Traders who adjust them well work out which piece is actually in trouble, and then find out whether the trade is still worth defending at all. Sometimes the honest answer is that it isn't.
The setup: near the top of the tent, five days out
An SPX put broken wing butterfly — long 6300, short the 6450 body, long 6650 — with the index at 6,480 and expiry on Jul 31 at 16% vol.
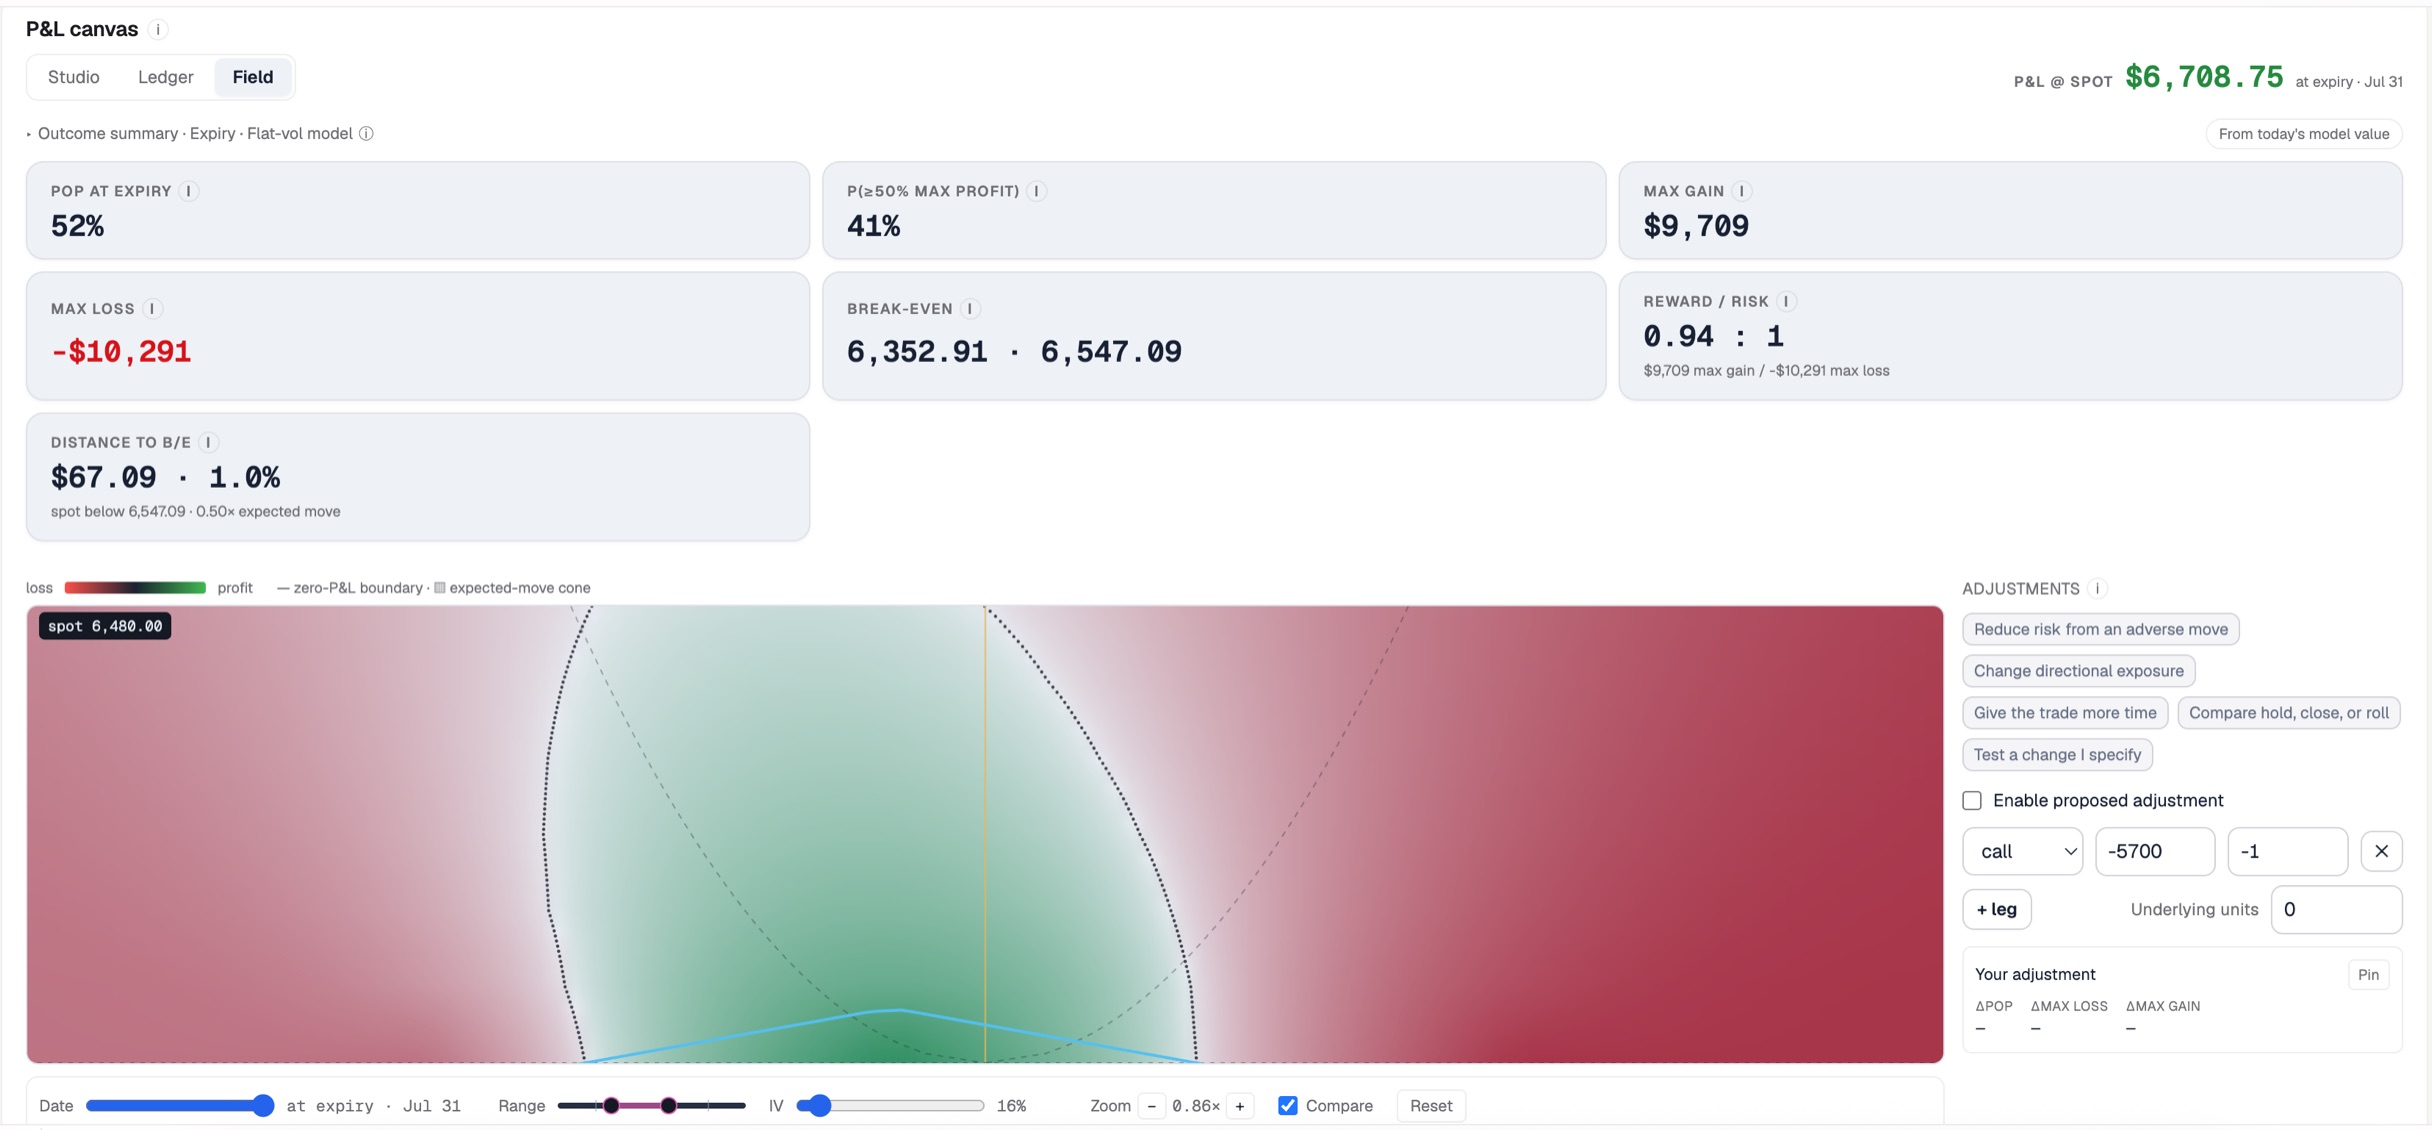
Read the headline numbers as a set and the position stops looking comfortable:
- Max gain $9,709 against max loss $10,291 — reward/risk of 0.94 : 1. You are risking slightly more than you can make.
- 52% probability of profit. A coin flip.
- The tent runs from 6,352.91 to 6,547.09, and spot sits $67.09 below the upper edge — 1.0%, or 0.50× the expected move.
Half an expected move from the edge of a coin flip, with slightly negative reward/risk, is not a position you'd open today. That observation is the whole article; everything below is the app proving it.
Two readings of the same five legs
Before adjusting anything, the app asks what you own. Its default answer is not the one you'd expect:
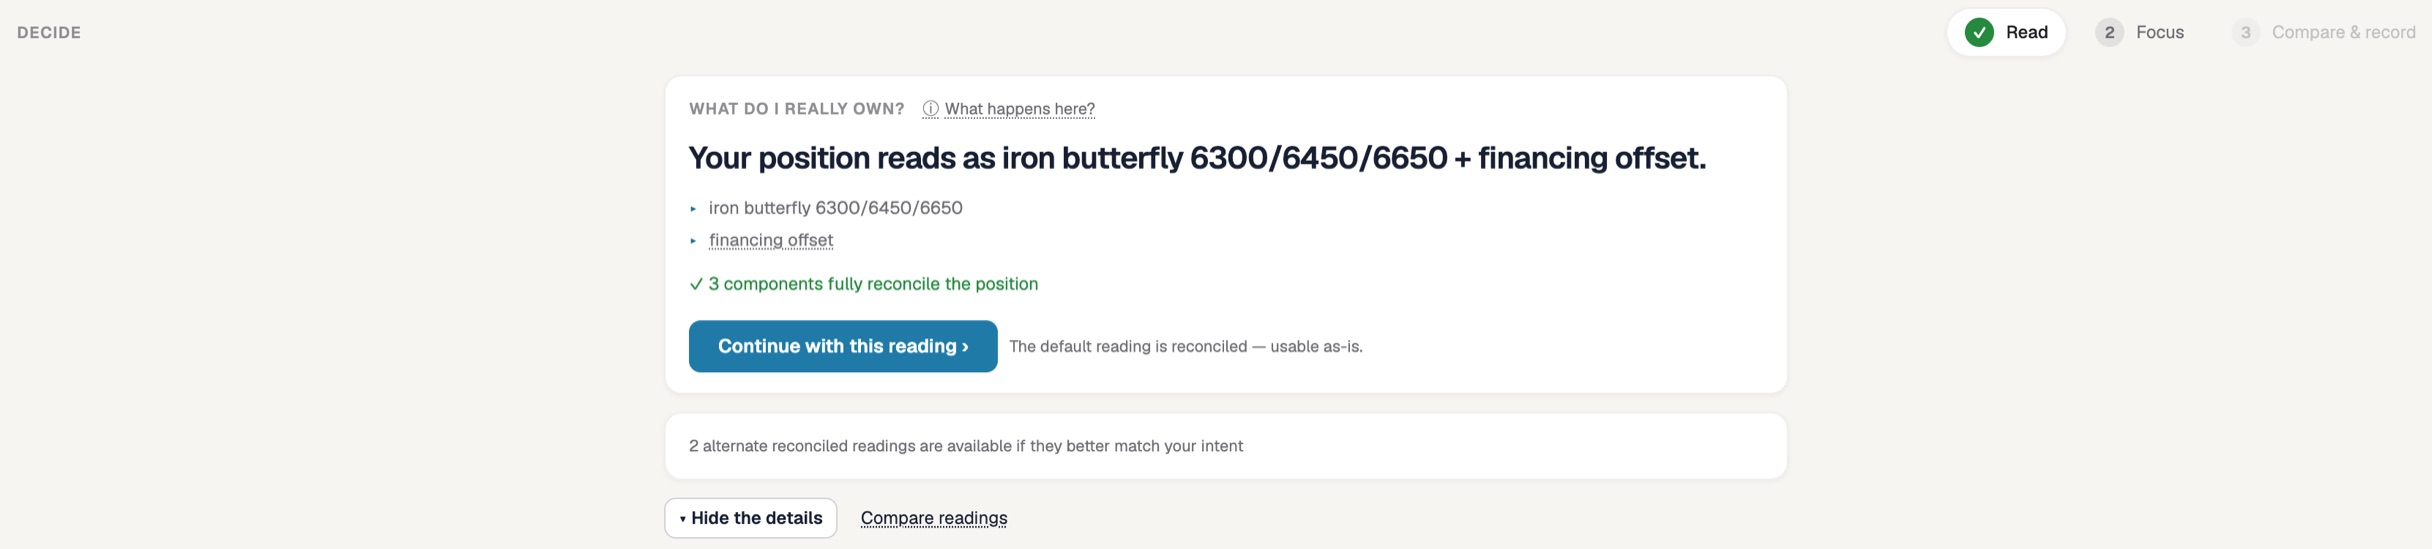
An iron butterfly, not a broken wing — same contracts, different lens. Both readings reconcile, which is the point: a reading is a way of seeing, not a fact about the world. Switch to the broken wing reading and the decomposition opens up:
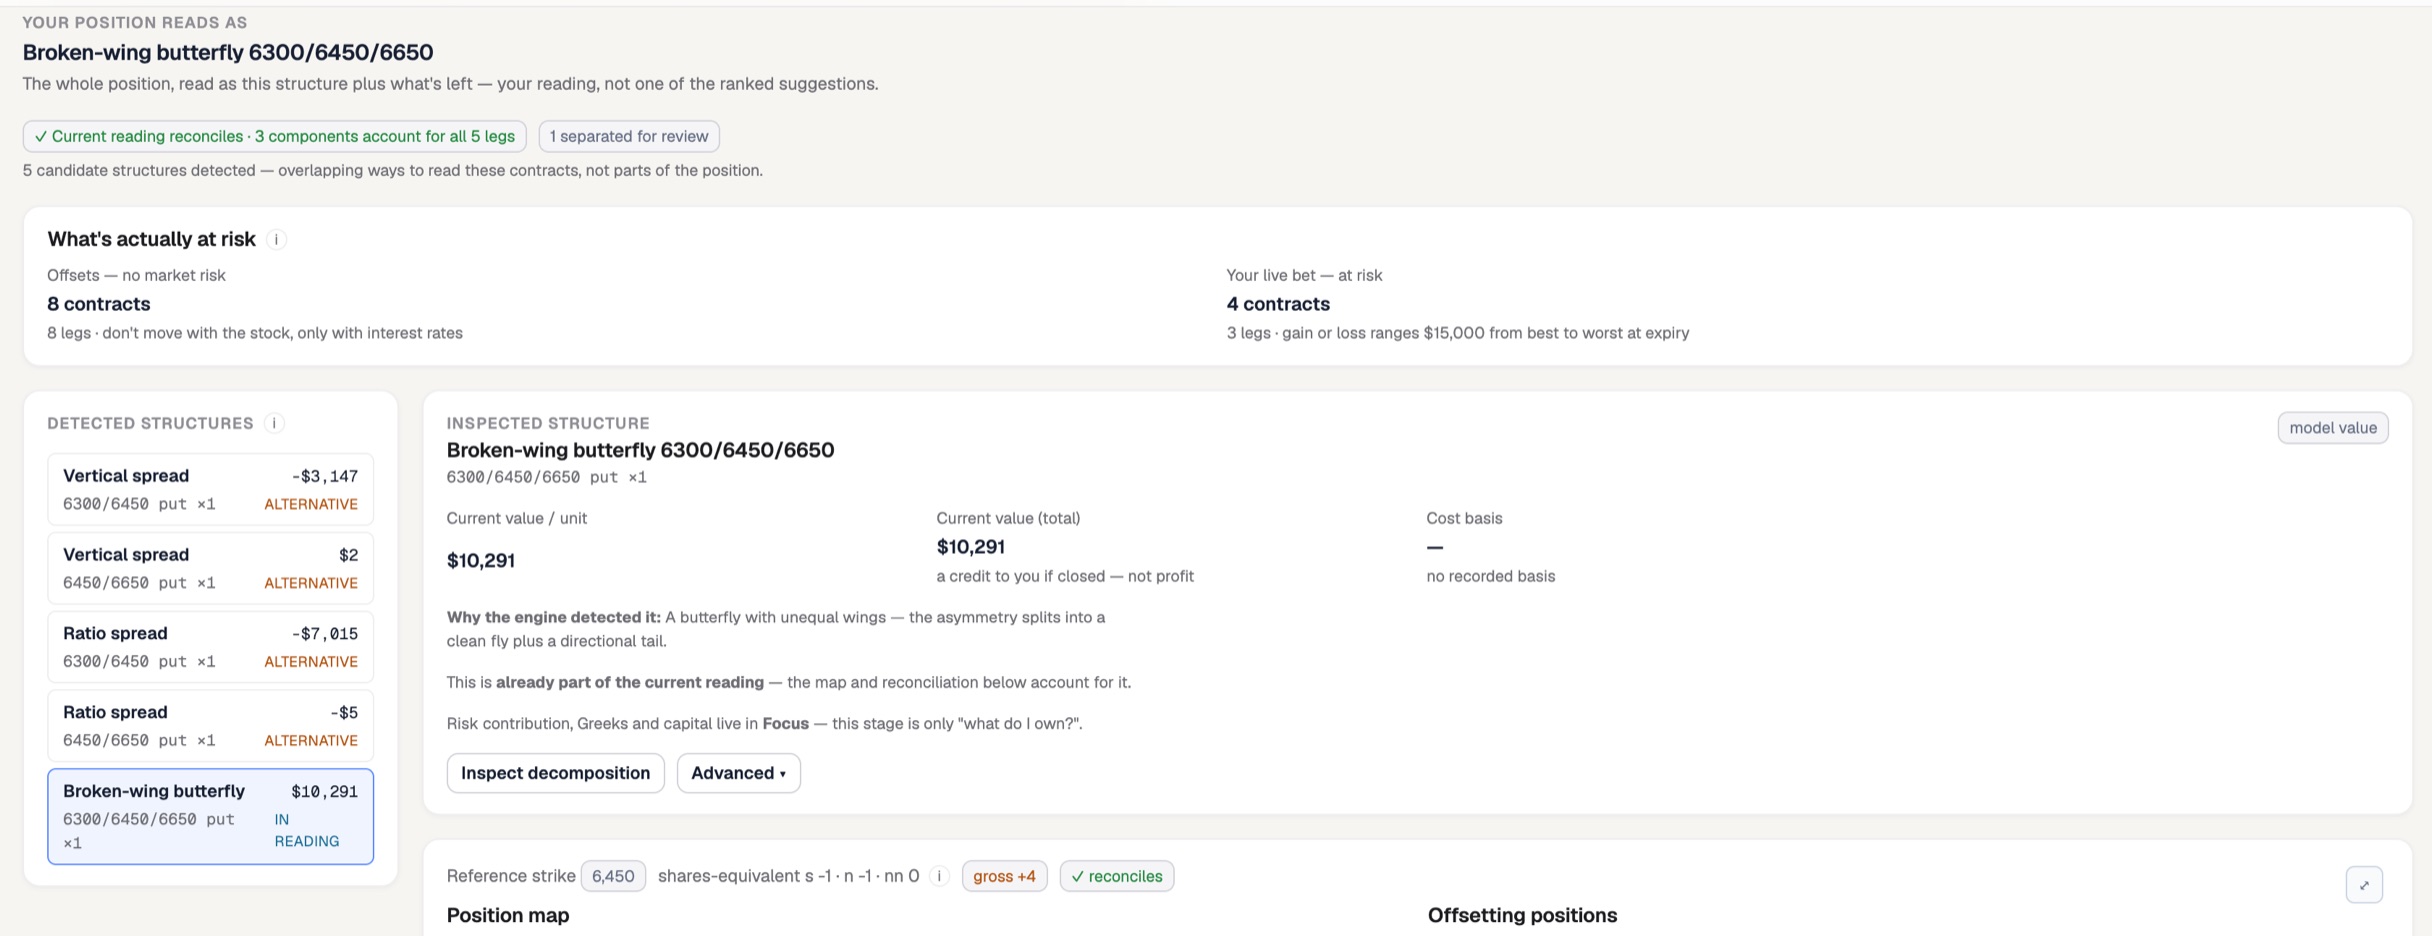
Three things here are worth more than the chart above them.
The at-risk split. Of what's in the account, 8 contracts are offsets with no market risk — they move with interest rates, not with SPX. 4 contracts are the live bet, and across them the outcome "ranges $15,000 from best to worst at expiry." Most position screens would show you thirteen line items and let you infer the exposure. This says plainly: three legs matter.
The candidate structures are alternatives, not parts. The list prices the same contracts read five different ways — the 6300/6450 vertical at -$3,147, the 6450/6650 vertical at $2, a 6300/6450 ratio at -$7,015 — and marks them ALTERNATIVE, with only the broken wing IN READING. They overlap. Adding them up would be double-counting, and the app refuses to let you.
The value is not profit. The fly is worth $10,291, and the app labels it precisely: "a credit to you if closed — not profit." With no recorded cost basis, that number tells you what walking away pays, not whether you've won.
Where the risk actually lives
Step 2 attributes a scenario piece by piece. Expand it, choose the upside lens, and the answer is unambiguous:
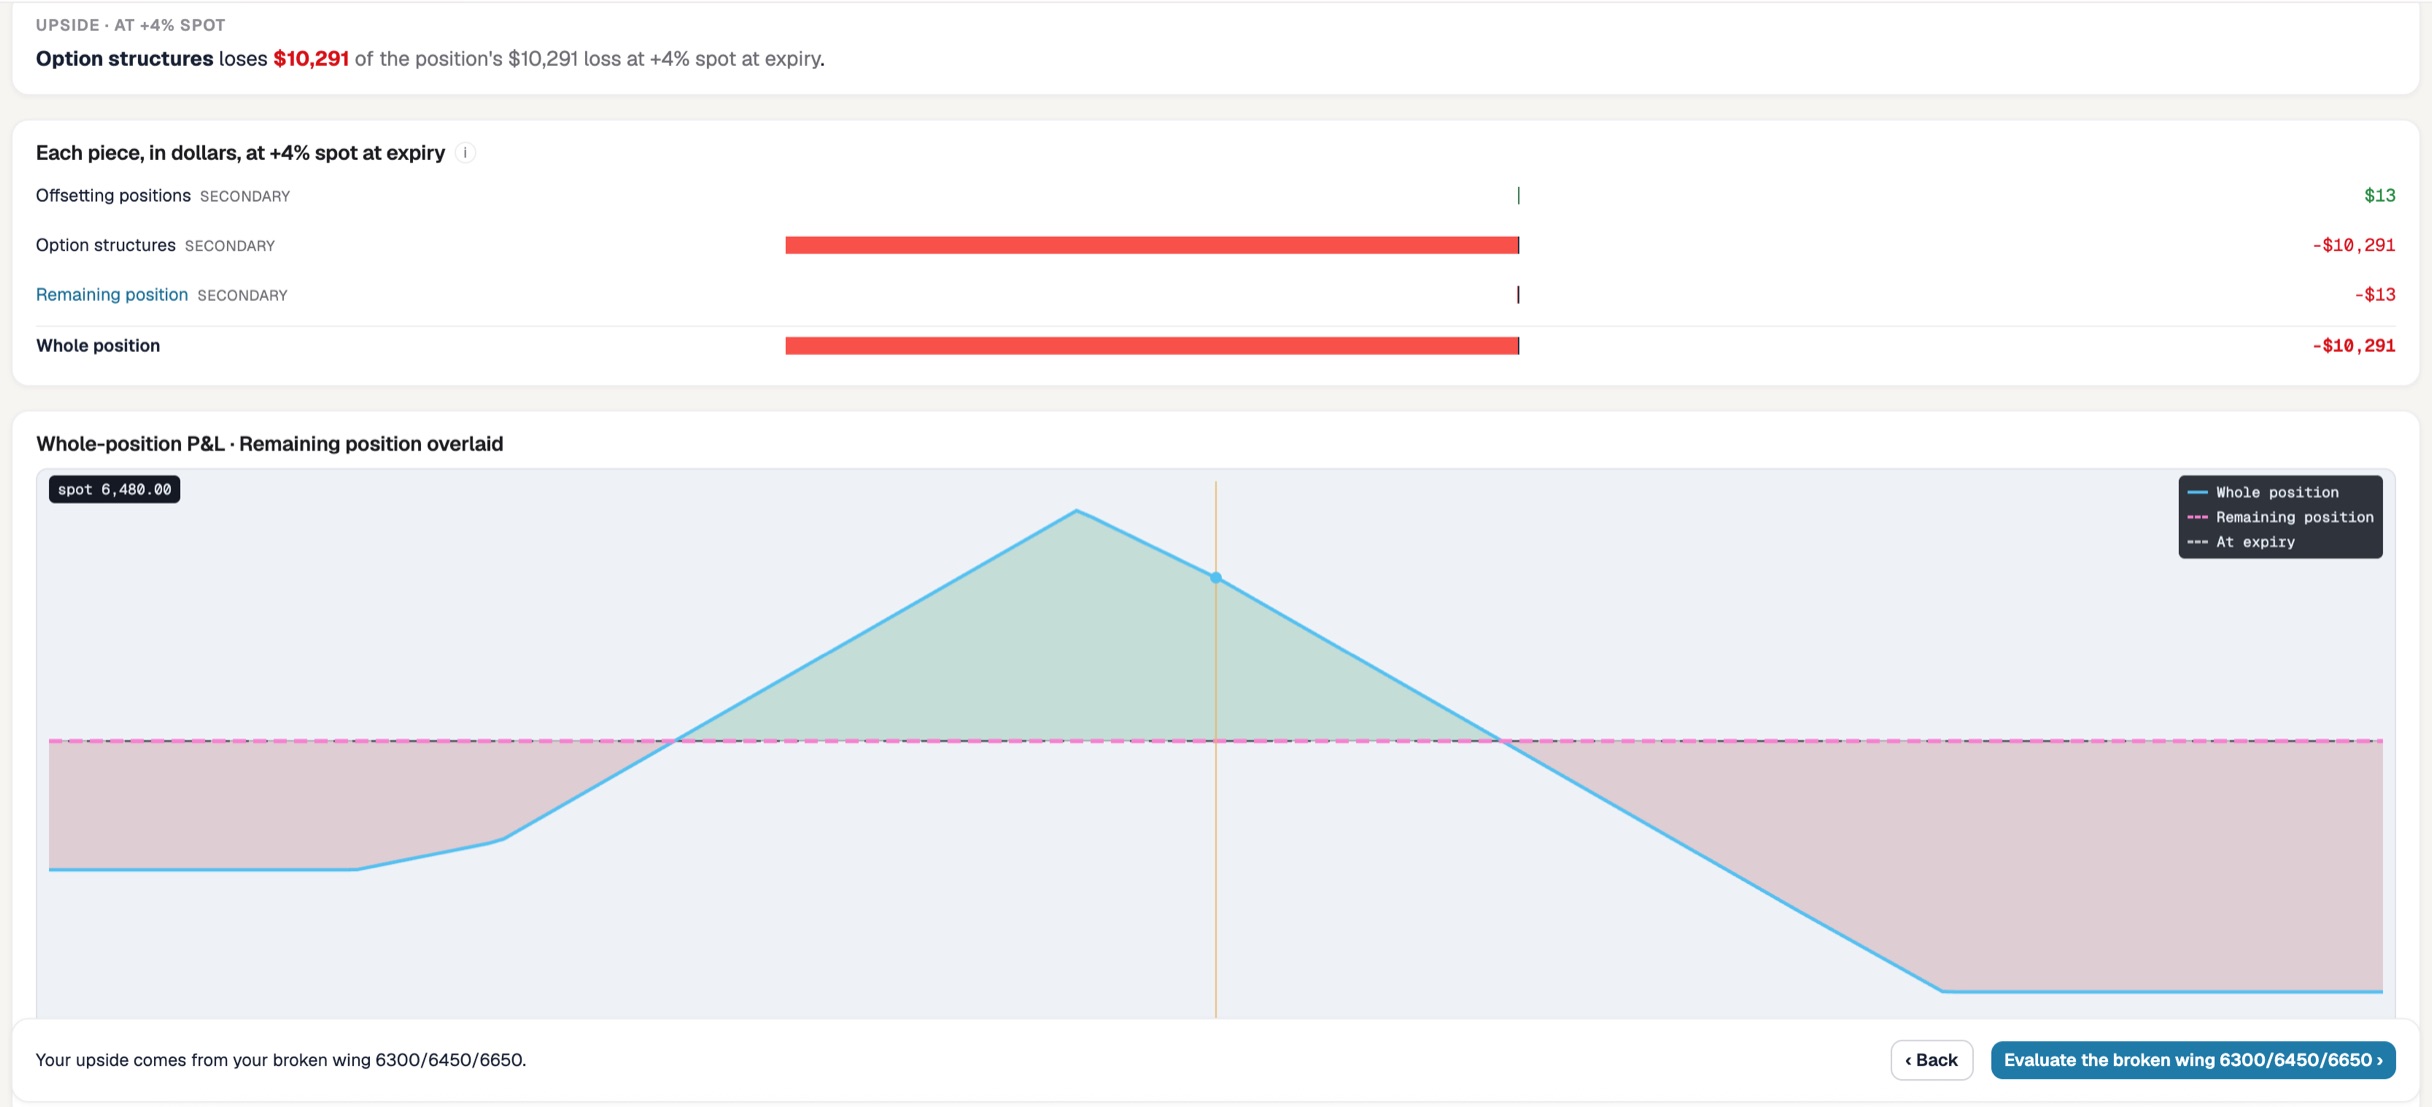
At +4% spot the position loses $10,291 — the entire thing — and the option structures own all of it. Offsetting positions contribute thirteen dollars. The components reconcile to the whole, which is what makes the attribution worth trusting.
Note which direction that is. This is a put butterfly, and the scenario that erases it is the market going up, through the upper break-even and out the top of the tent. The classic BWB anxiety — "what if it crashes through my broken wing" — is not this trade's problem. Adjusting for a crash here would be defending a door nobody is trying to open.
What each branch is worth
Closing first. The app checks what closing leaves behind, and finds nothing alarming:
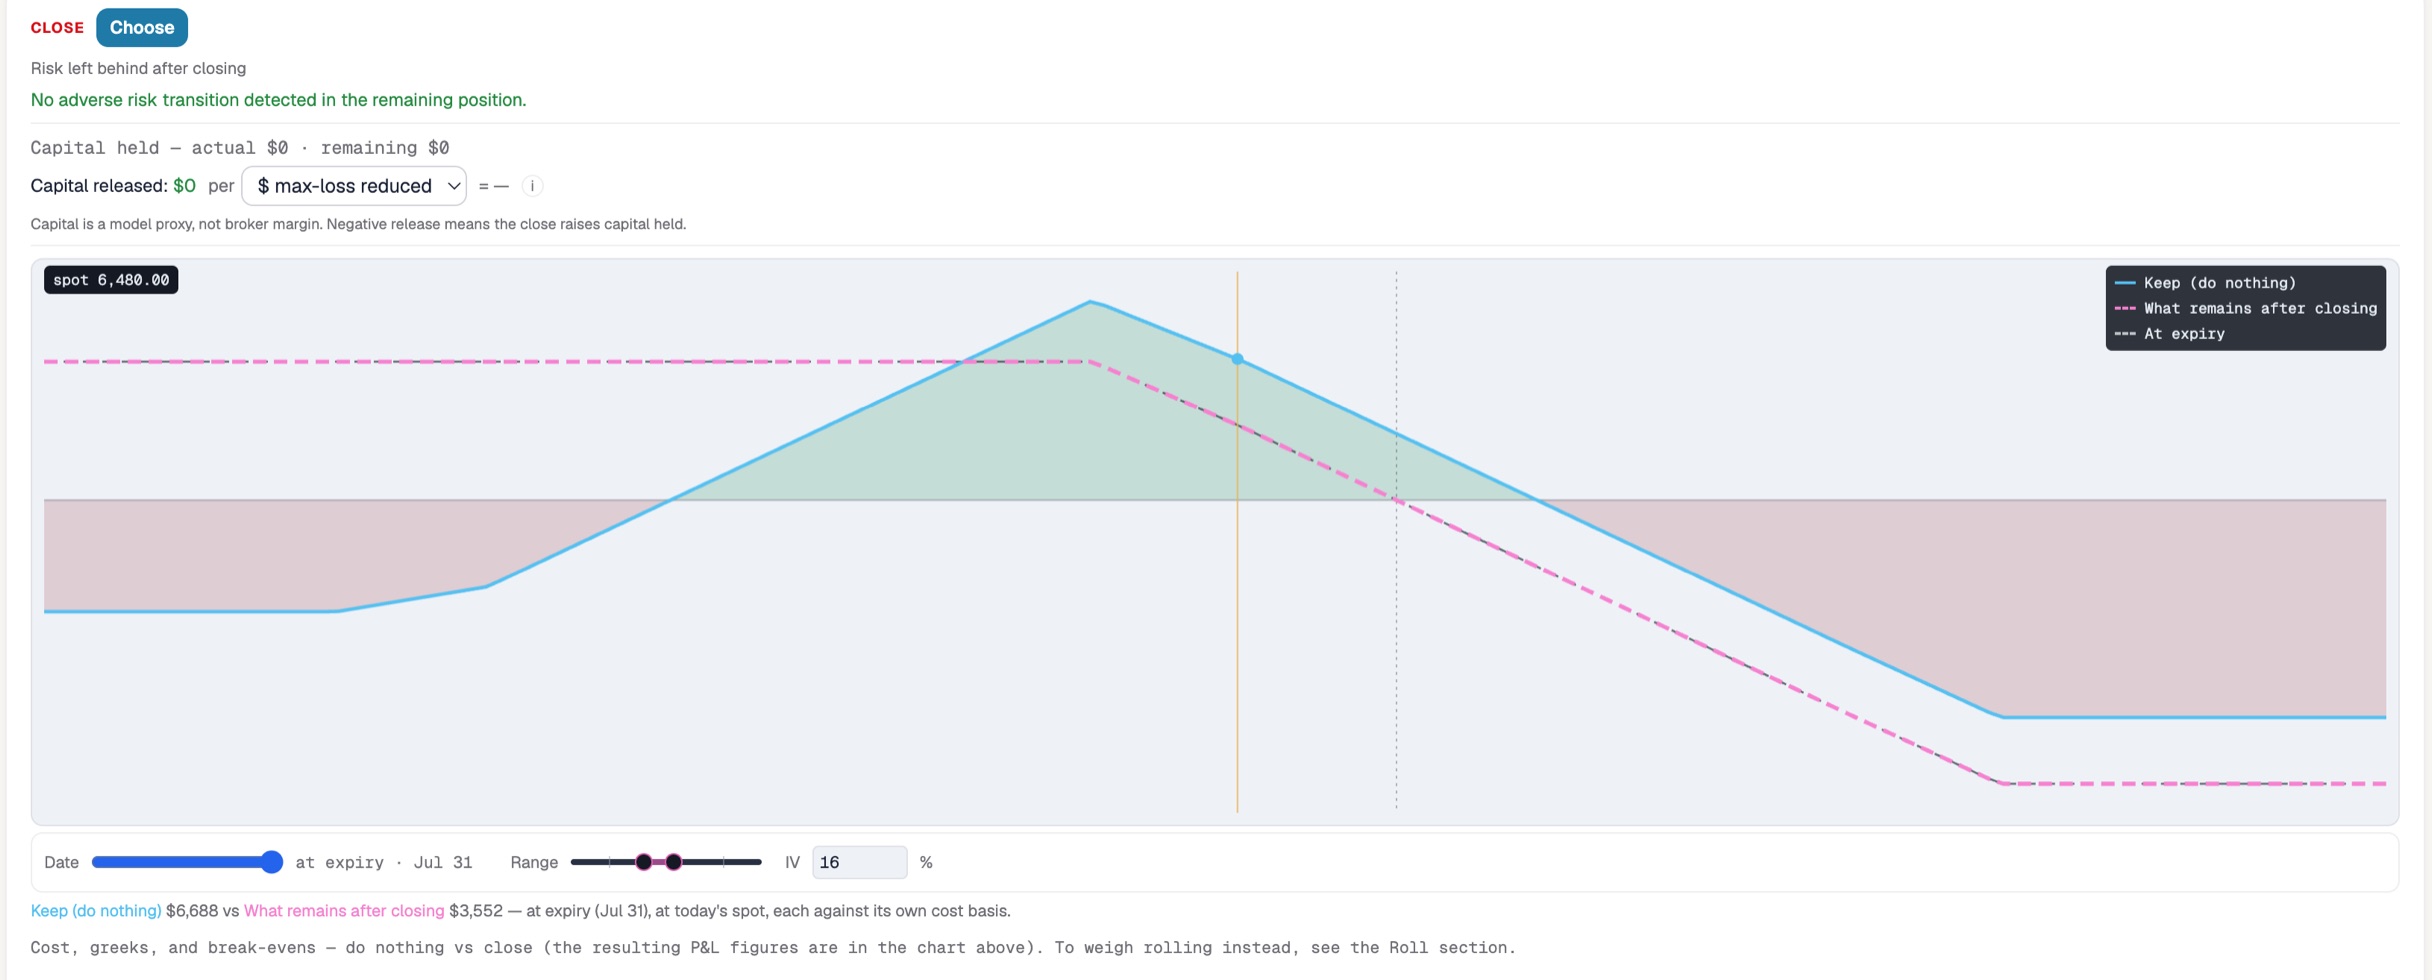
Capital held: $0. A long butterfly is a debit position — it ties up no margin, so closing releases none. That removes the usual argument for closing a working trade. If you close this, it's for the risk, not the capital.
Then price all three branches under the same shocks:
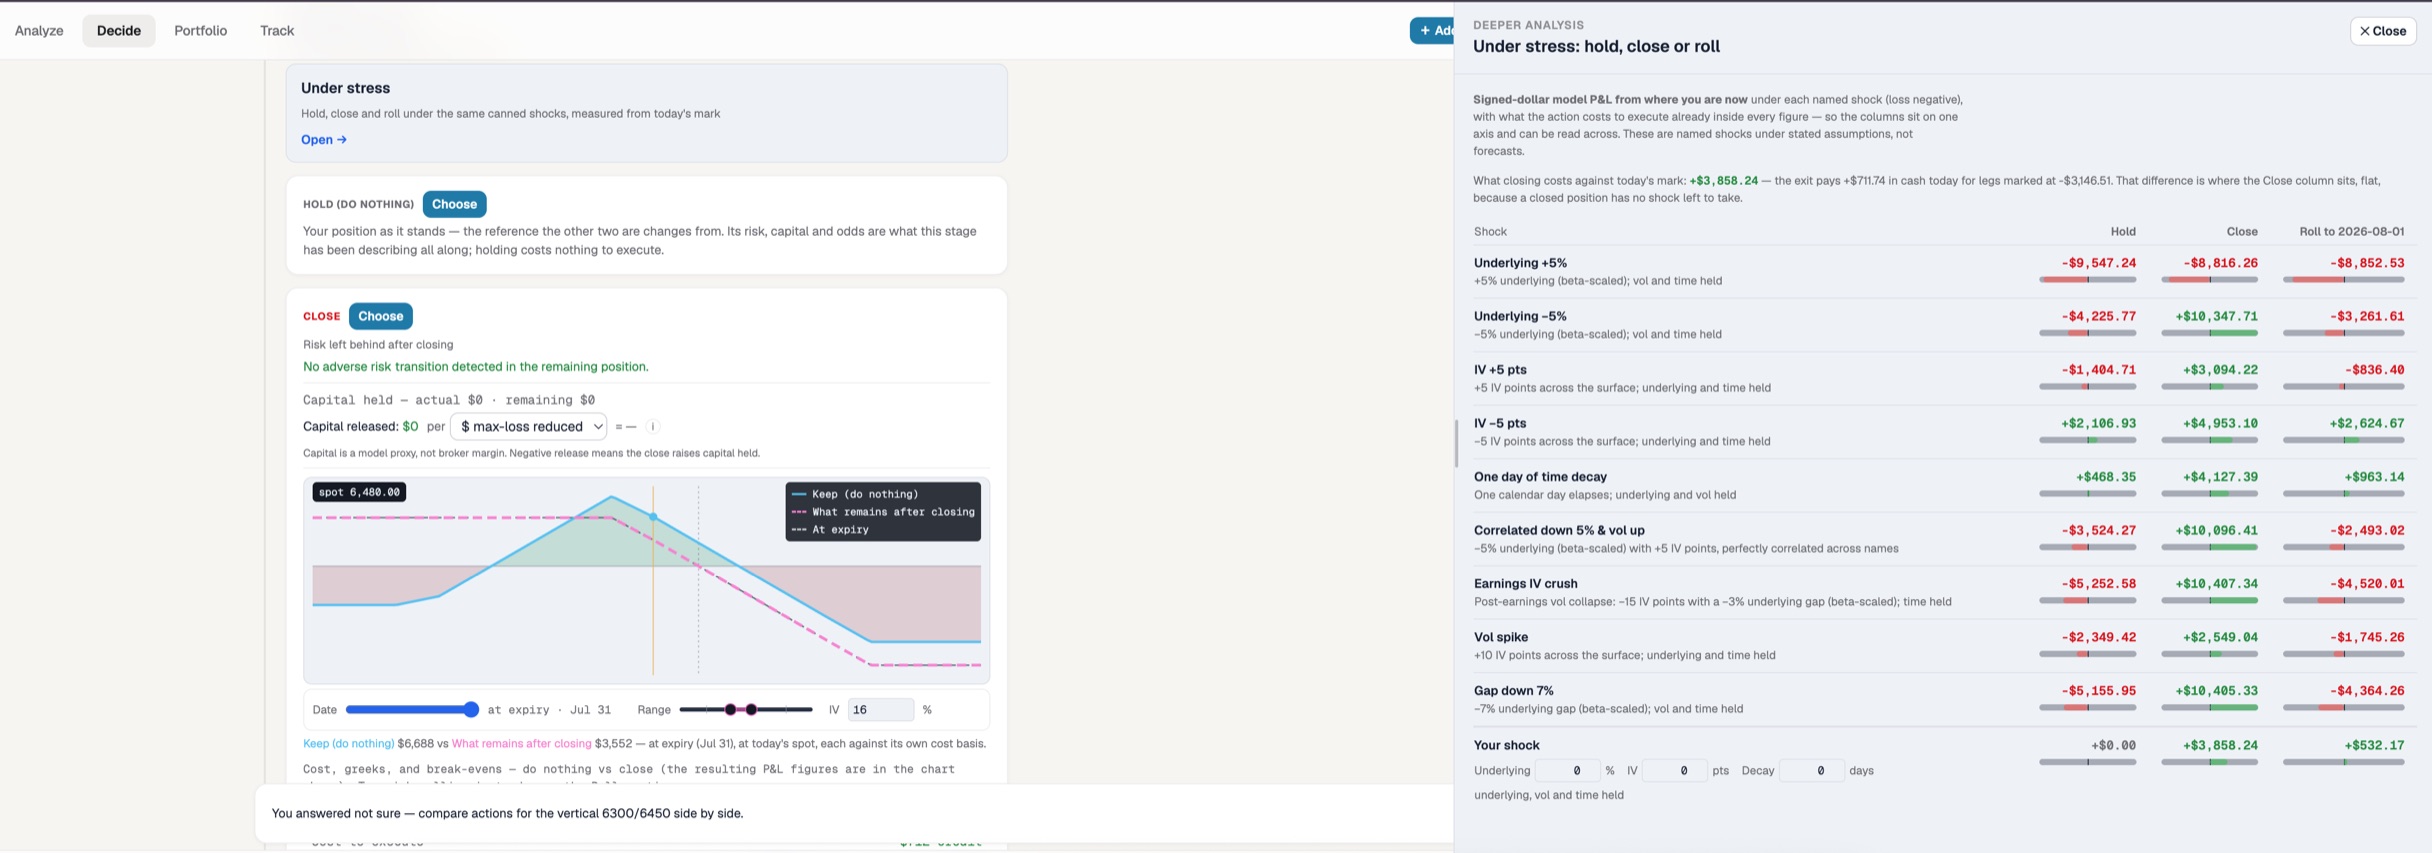
Read down the Hold column and the trade indicts itself. Holding loses money in seven of the nine shocks: -$9,547 on a 5% rally, -$4,226 on a 5% drop, -$5,253 on an earnings vol crush, -$5,156 on a 7% gap down, -$2,349 on a vol spike. It makes money in exactly two — a 5-point IV decline (+$2,107) and one day of nothing happening (+$468).
Now read across. Closing beats holding in every single row, including the one where both are ugly: on a 5% rally close loses $8,816 against holding's $9,547. On the downside rows the gap is enormous — a 7% gap down costs the holder $5,156 and pays the closer $10,405.
The header explains where that comes from without dressing it up: closing is worth +$3,858.24 against today's mark, because "the exit pays +$711.74 in cash today for legs marked at -$3,146.51." And the Close column sits flat across shocks for the plainest possible reason — "a closed position has no shock left to take."
There's also a Your shock row where you set the move, the IV change and the days yourself, rather than accepting the canned list. Set it to nothing at all — 0%, 0 points, 0 days — and it prices the pure cost of acting today: hold $0.00, close +$3,858.24, roll +$532.17.
When rolling just adds risk
Rolling is the move most traders reach for here, and it even comes with a sweetener:
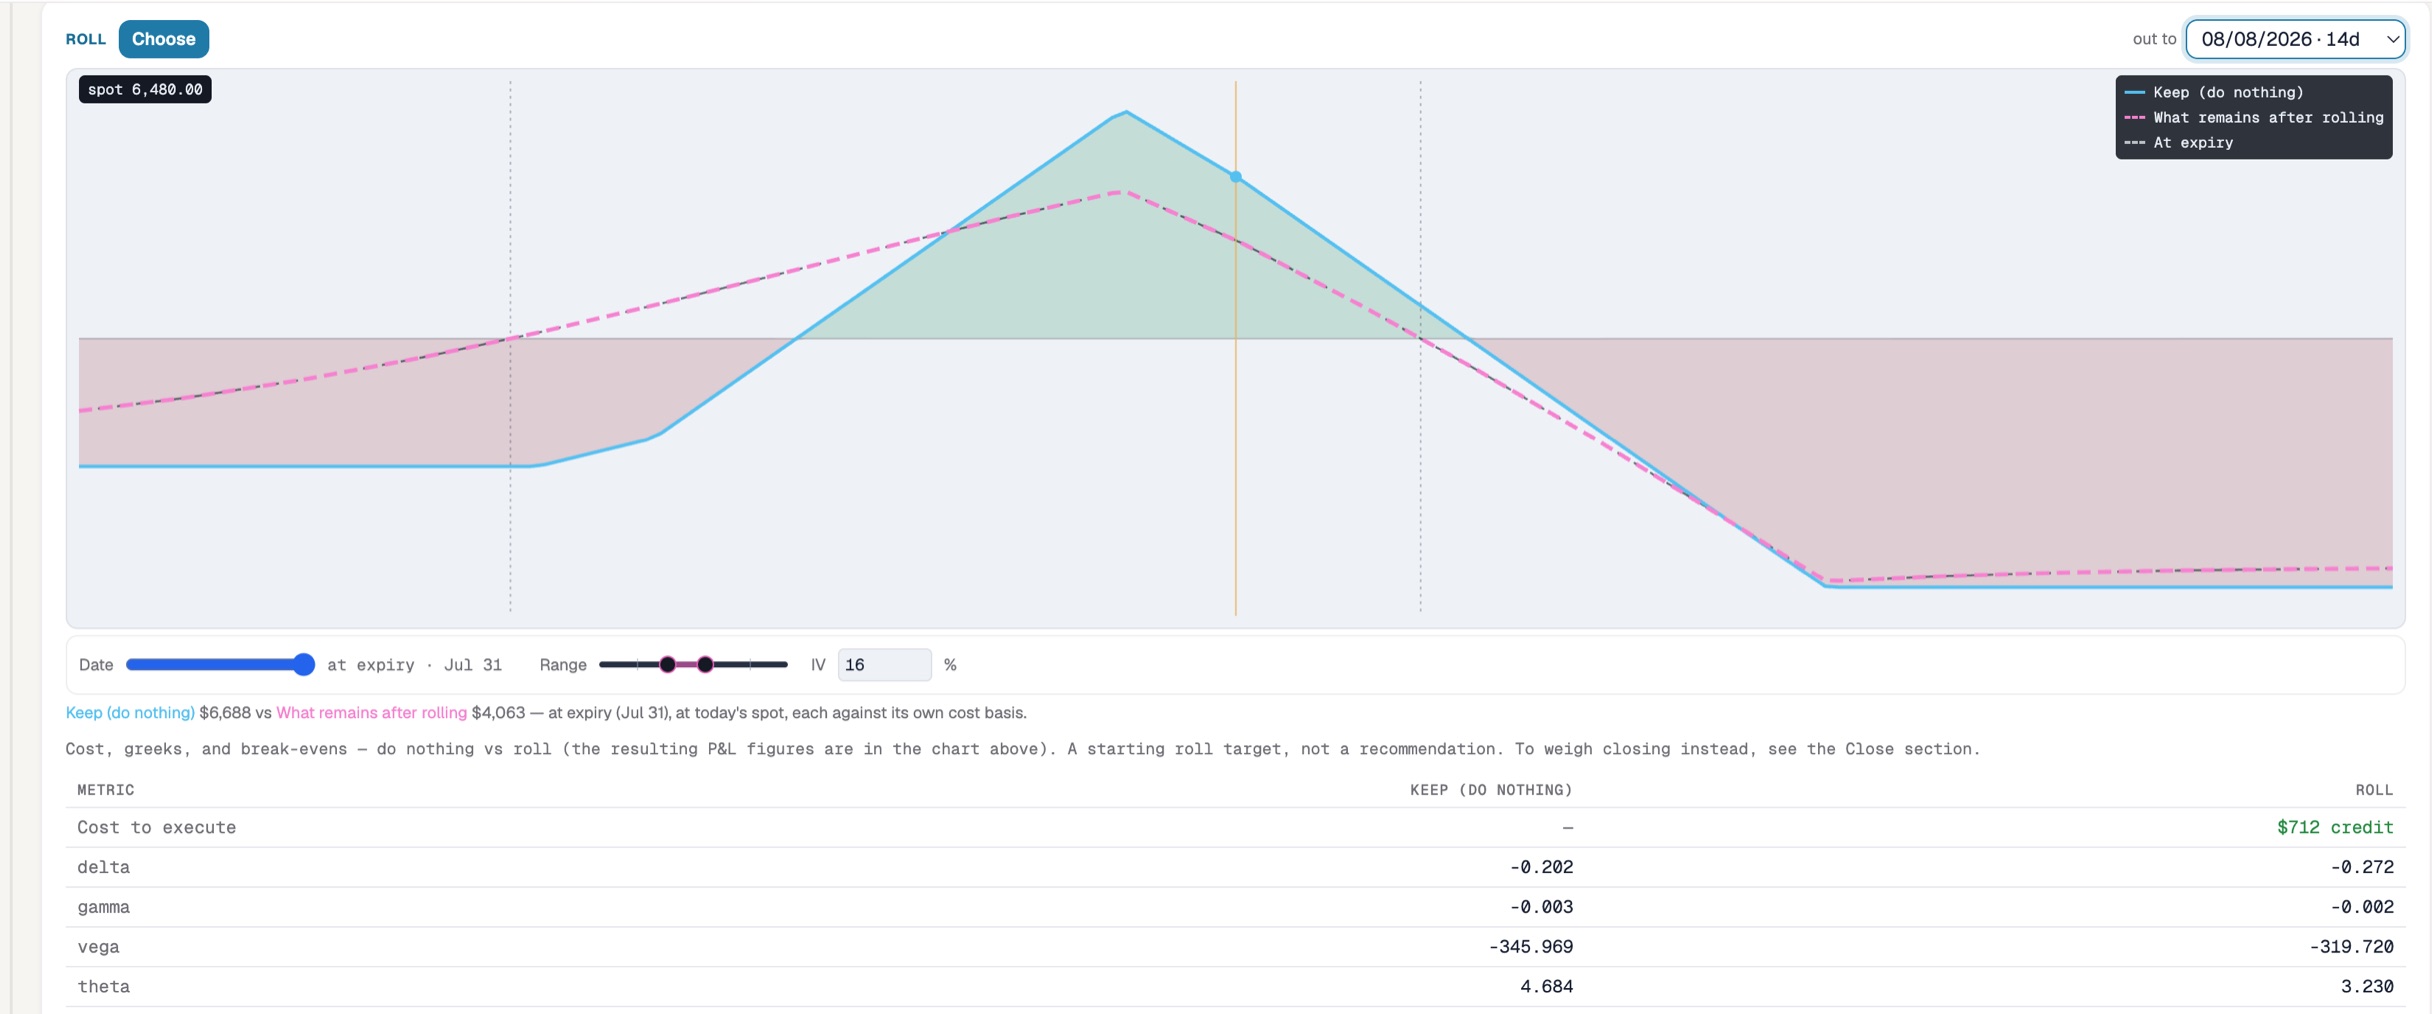
The roll pays you $712 to do it. That credit is the trap. Look at what it buys:
- Keeping is worth $6,688; what remains after rolling is worth $4,063. You collected $712 and gave up $2,625 of position value.
- Delta gets more negative (-0.202 to -0.272) — you are more exposed to the rally that is the actual threat.
- Theta drops from 4.684 to 3.230, so the clock pays you less.
- Vega improves slightly (-346 to -320), which is the one honest gain.
And in the stress table the roll never once beat closing. A credit is not a reason. The app labels the roll target exactly right: "a starting roll target, not a recommendation."
The dissection rule generalises: adjust the component, not the silhouette. Broken wing butterfly = butterfly + directional tail. Iron condor = two verticals. Decompose the position, find which piece owns the risk, and act on that piece — or, when every branch says the same thing, act on the whole trade.
Deferring is a decision too
Suppose you're unconvinced. The numbers favour closing, but you want another day. Fine — that is a legitimate choice, and the app treats it as one rather than as an absence of one:
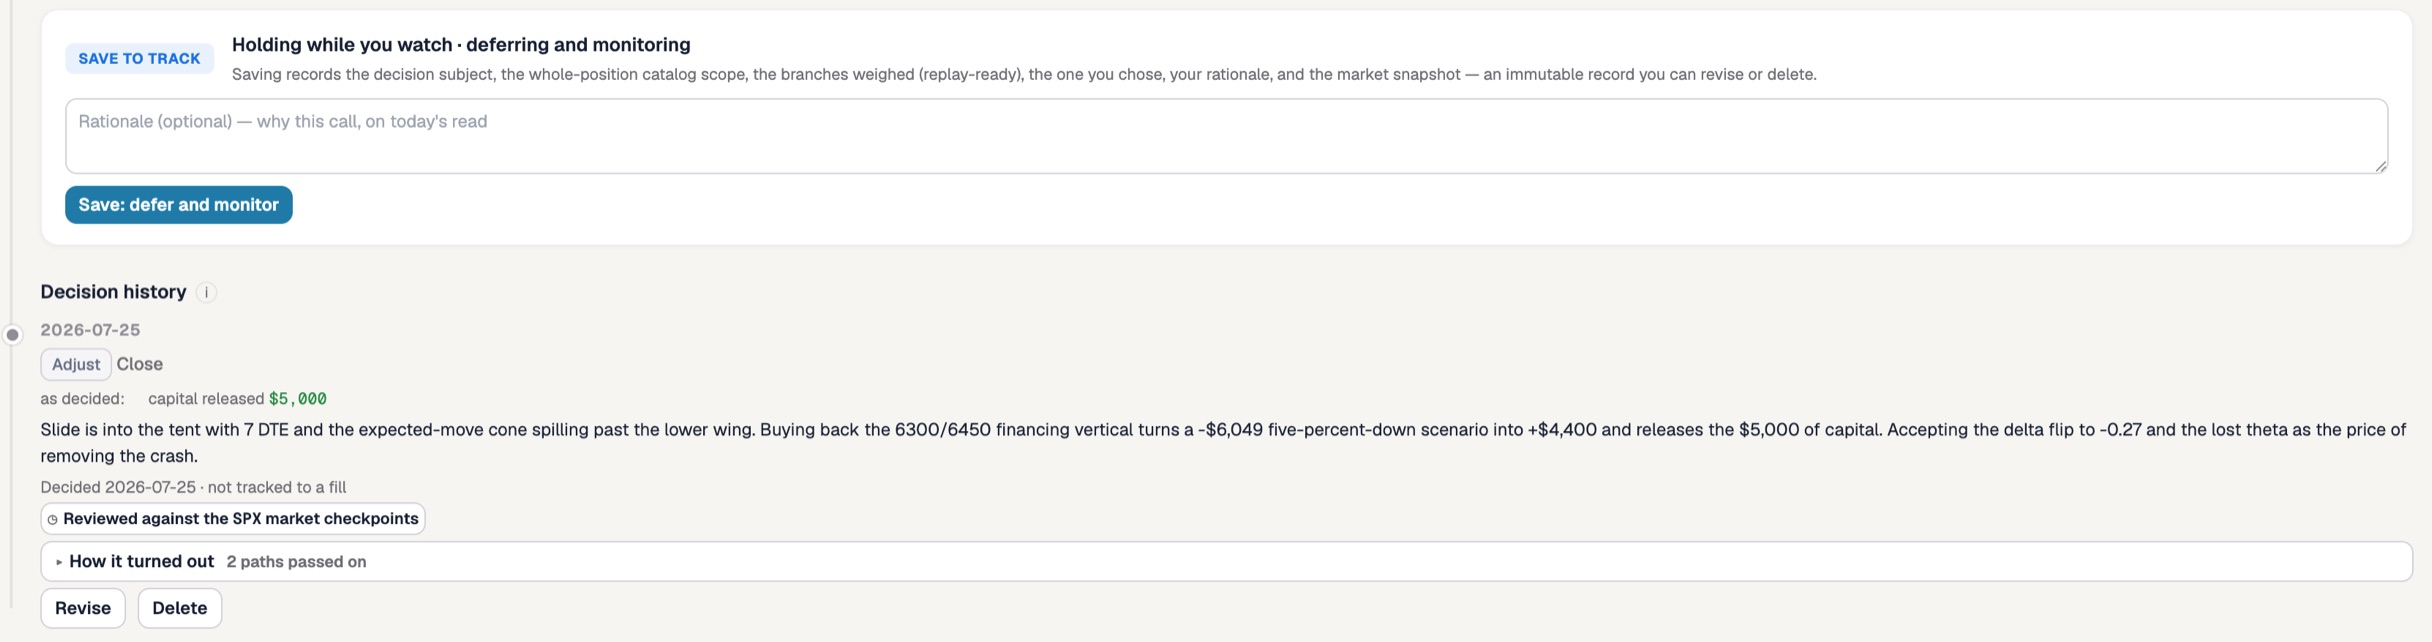
The branch is named "holding while you watch · deferring and monitoring" — not "hold," which sounds like conviction, and not nothing, which is what deferring usually leaves behind. Saving records the branches you weighed, the one you took, the market snapshot and your reasoning, as an immutable entry you can revise or delete.
Then it does the thing that makes the record worth keeping: "How it turned out" collects market checkpoints against the decision as time passes. Not a scorecard — the app doesn't grade you — but the raw material for the only question that improves a trader. Not was I right, but was I right for the reason I wrote down.
See your positions as they actually are
Everything above was mechanical: read the position two ways and check both reconcile, attribute the risk to a component, price every branch under identical shocks, and record the call before the outcome is known. The trade here turned out to be finished — reward/risk under 1:1, half an expected move from the edge, and a close that beats holding in every row of the table. But the process is the product, not that conclusion.
Position dissection — carving a book into the butterflies, verticals and ratios it's really made of, with every component reconciling back to the whole — is the core of how Risk Illustrator works, and comparing the branches side by side is what its Decide tab is for. Model the decision, not just the trade.
All figures are model values under flat volatility for illustration — live markets add skew, spread, and assignment considerations. Nothing here is investment advice.