The worst adjustment decisions share a signature: they were made about the past. "I can't close here, I'd be locking in a loss." "If I roll, I haven't really lost yet." Both sentences are about money that's already gone.
Here's the uncomfortable accounting truth that fixes most adjustment thinking: your loss is already real. The market doesn't know your cost basis. The only thing you control is which position you hold from this moment forward — and every choice, including "do nothing," is a choice to hold some position at today's prices.
So the framework starts by renaming the branches:
- Hold = "I would open this exact position right now."
- Roll = "I would open the rolled position right now, and pay a fee to do it."
- Close = "I would open neither."
Once you say them that way, most defenses answer themselves. Let's put numbers on it.
A worked example: underwater, and still the favourite
An SPX put credit spread — long the 6450 put, short the 6500 put — with the index at 6,480 and expiry on Jul 31.
Note where spot is: twenty points below the short strike. This spread is in the money. It is not "under pressure" or "being tested"; it is losing, and the ledger says so precisely — the legs are marked at -$2,295.88.
And now the part that makes this a real decision rather than a morality tale. The model puts the odds of this position finishing profitable at 59%.
Down money and still the favourite. Almost every piece of adjustment advice you've read assumes those two things can't be true at once, which is why almost every piece of adjustment advice is useless in the moment.
"Not sure" is a decision, and it has a default
The Decide flow asks one question, and it's the whole framework compressed into a sentence: would you put this on today, at these prices, with no position?
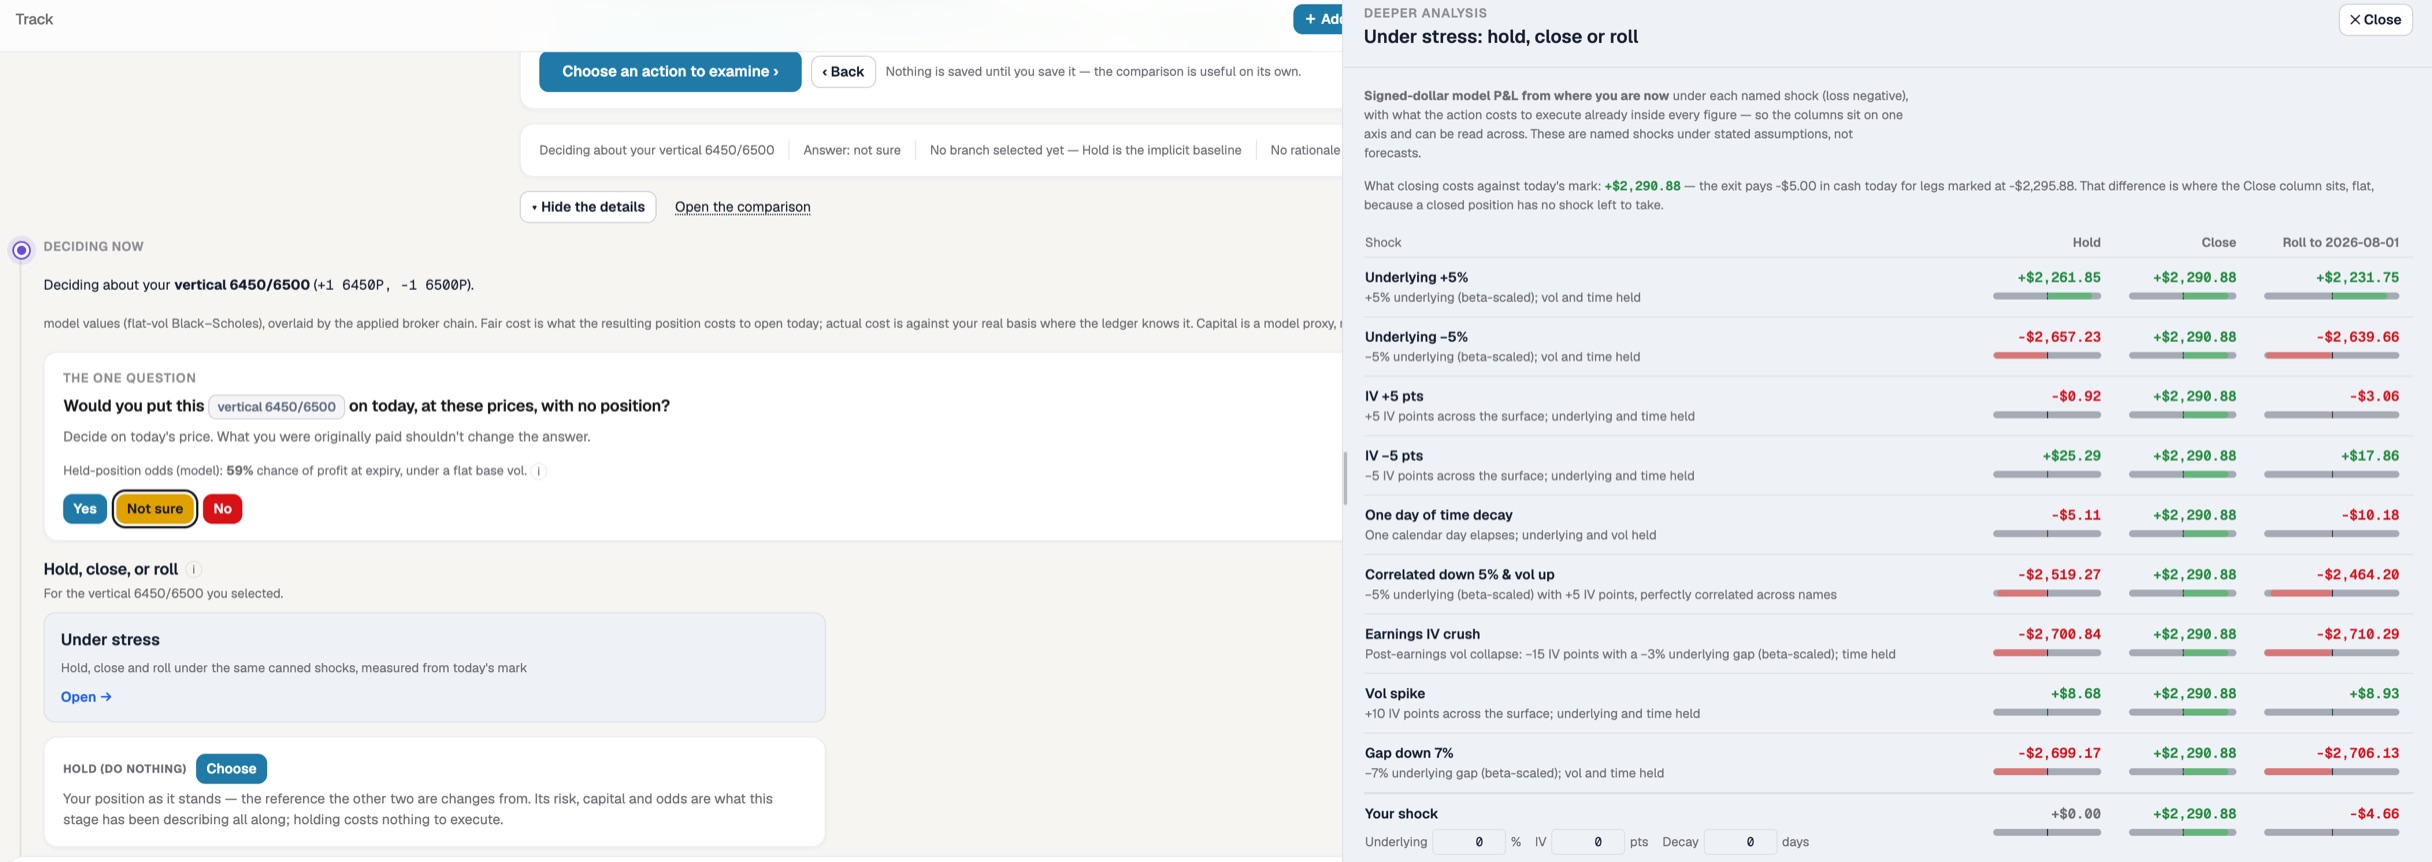
The answer given here is "not sure" — the honest answer for most people, most of the time. Watch what the app does with it. It writes, in plain text: "No branch selected yet — Hold is the implicit baseline."
That single line is worth more than the rest of this article. Not deciding is not neutral. It is a decision to hold, made by default, without pricing it. Every trader who has ever said "let me see how it opens tomorrow" has chosen the hold branch — they just didn't have to look at what it costs. Here you do.
So look. Read down the Hold column and the shape of the risk is obvious: a 5% rally pays +$2,261.85, but a 5% drop costs -$2,657.23, a 7% gap down -$2,699.17, an earnings vol crush -$2,700.84. The volatility rows barely move — -$0.92 for five points of IV, +$8.68 for a vol spike. This is a pure direction bet with the clock nearly irrelevant, which is exactly what a short vertical becomes once price is through the strike.
Now read the Close column: +$2,290.88. In every single row. Not approximately — identically, from the 5% rally to the gap down to the earnings crush. The app explains why in one sentence: "a closed position has no shock left to take."
That is the clearest statement of what closing actually buys that any tool has ever put on a screen. It doesn't buy a better outcome. It buys the same outcome in every future, which is a different thing and is sometimes worth a great deal.
There's also a Your shock row where you dial the move, the IV change and the days yourself. Set all three to zero — no move, no vol change, no time — and it prices the pure cost of acting today: hold $0.00, close +$2,290.88, roll -$4.66.
The close: what it costs and what it frees
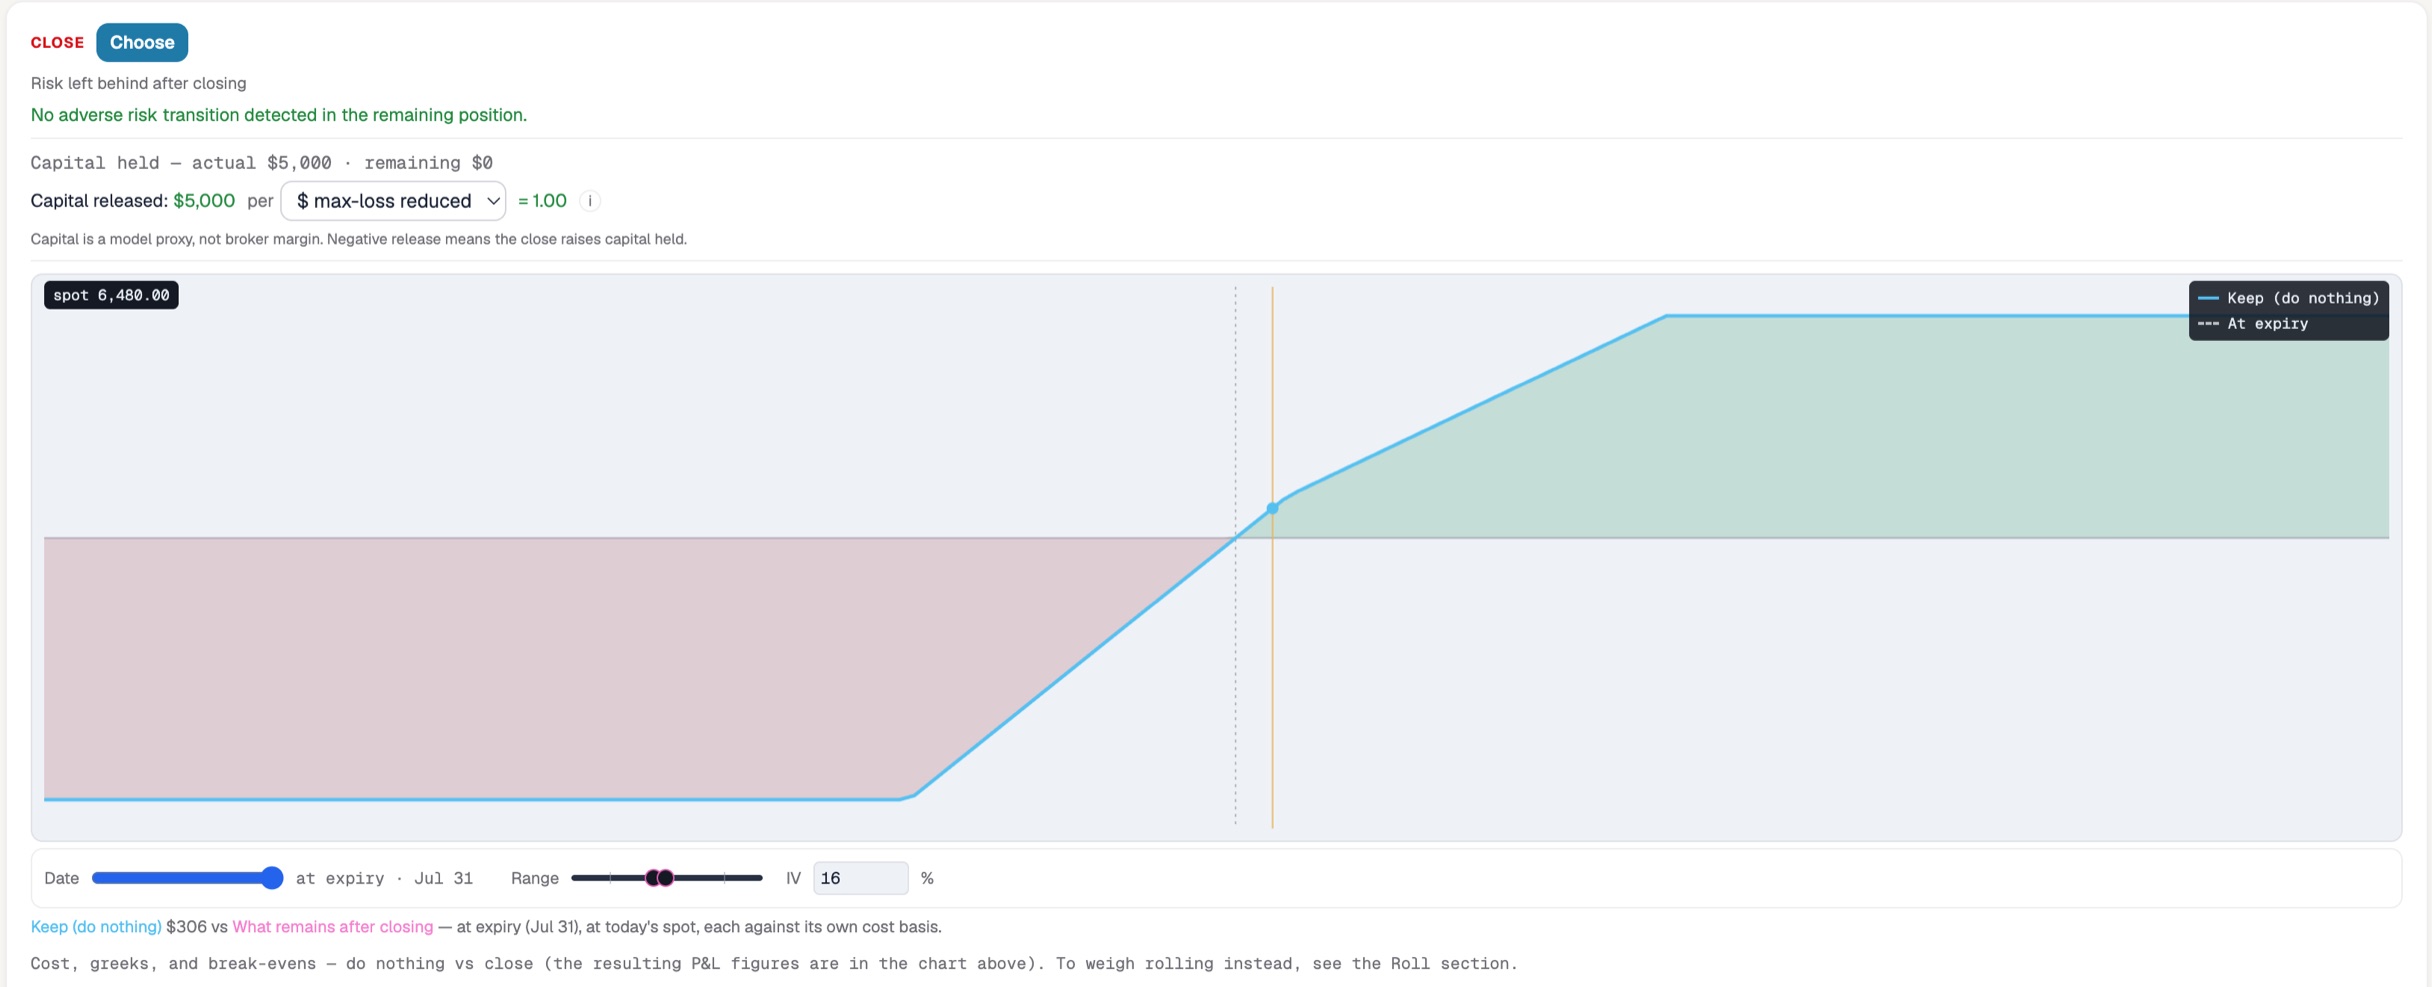
Three things the app says here that are easy to skim past.
"Capital released: $5,000 · 1.00 per $ max-loss reduced." You get the entire $5,000 back, and every dollar of it corresponds to a dollar of risk removed. That ratio is the honest test of a defensive move — an adjustment that frees capital without reducing risk is just a reshuffle.
Exiting costs $5.00 in cash. Against a mark of -$2,295.88, the transaction cost of ending this is a rounding error. "I'll close it when it's cheaper to close" is not a plan; it is already cheap.
The chart has only one line. There is no "what remains after closing" curve, because nothing remains. Compare that to the condor case, where closing one side leaves you holding the other and quietly flips your delta. Here, close means closed.
The roll: paying to be wrong more slowly
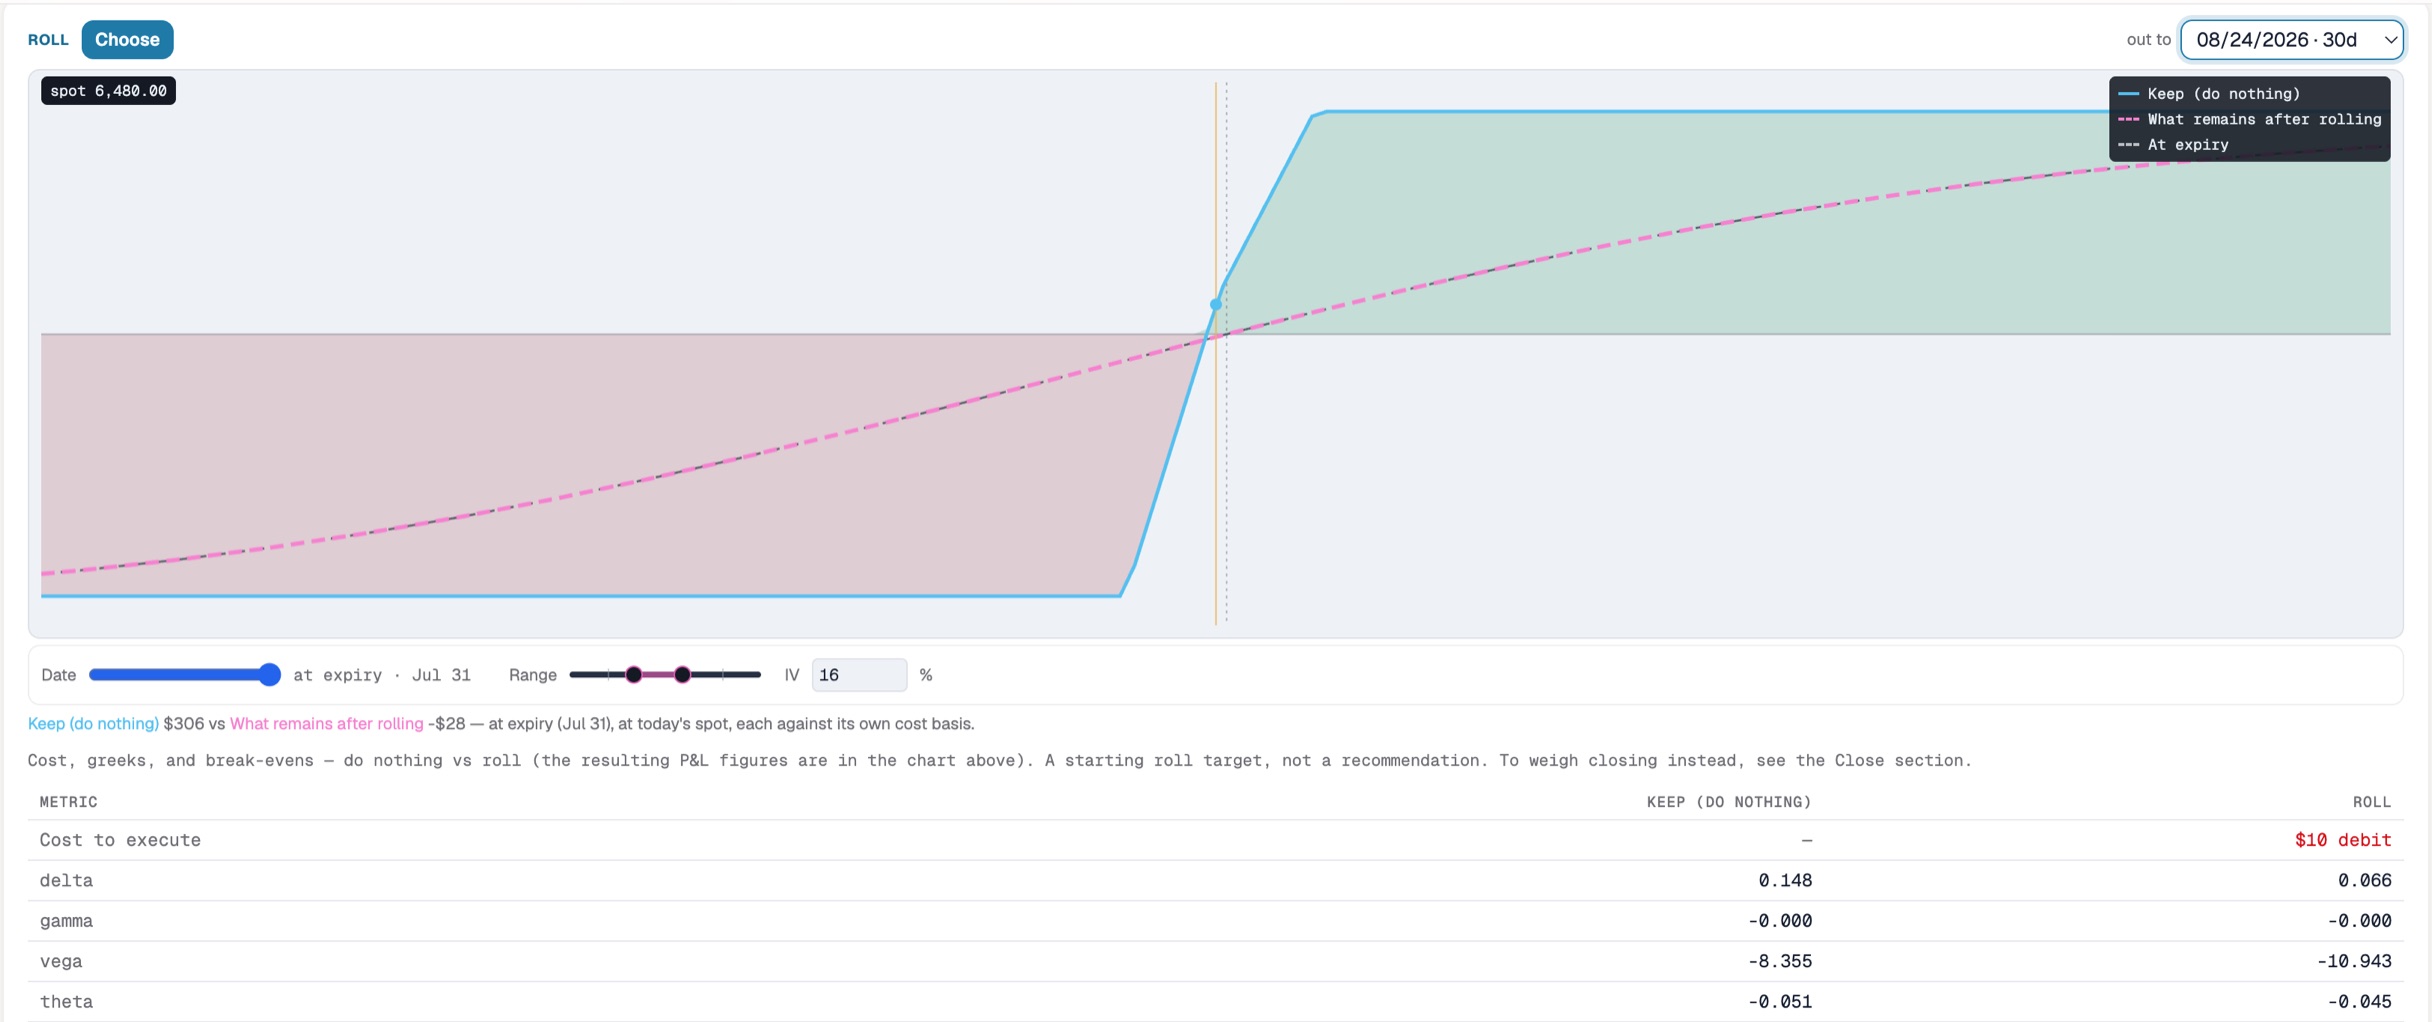
The roll takes the position out 30 days for a $10 debit — cheap enough that it feels like nothing. Price what the ten dollars actually buys:
- Keeping is worth $306. What remains after rolling is worth -$28. You paid $10 to convert a small positive into a small negative.
- Delta halves, 0.148 to 0.066. That sounds like risk reduction, and in isolation it is — but the direction bet is the only thing that was going to save this trade. You've muted your own recovery.
- Vega gets worse, -8.355 to -10.943. You've bought thirty more days of exposure to a volatility move you have no view on.
- Theta is nearly unchanged, -0.051 against -0.045 — and note the sign. The clock is very slightly against you either way. There is no "let theta work" argument available here.
And in the stress table, the roll column tracks the hold column almost exactly — -$2,639.66 against hold's -$2,657.23 on a 5% drop, -$2,706.13 against -$2,699.17 on a gap down. It is the same trade with a longer fuse and a wider vega. The app's own label on it is the correct one: "a starting roll target, not a recommendation."
The five questions
Run these in order, before touching the position:
1. Is my original thesis dead or just delayed?
Price is through your strike. If that happened because something you explicitly didn't expect occurred — regime change, broken level, event landed badly — the premise is gone and no adjustment resurrects a premise. If it's ordinary drift, the 59% is telling you the thesis is merely late.
2. Would I open the current position fresh, today, at this price?
The one question, and the only one that ignores your basis. At 59% odds with $5,000 committed, this is genuinely arguable — which is the point. A framework that always answers "close" isn't a framework, it's a bias.
**3. Would I open the rolled position fresh — and is it a trade or a fee?**
Price the roll as its own trade: new expiry, new greeks, new max loss including the cost. Here it's a position worth -$28 with more vega and less delta than the one you already own. Nobody would open that on purpose.
4. What does each branch look like if I'm wrong again?
The stress table, read across. Hold loses roughly $2,700 in each of the three genuinely bad scenarios. Close loses nothing in any of them, and gains nothing either. Pick the branch you can survive in the future you don't expect.
5. Has this trade already used its adjustment budget?
One adjustment, entered with reduced expectations, is discipline. A second means you're managing the defense of a defense — at which point the realistic goal is a controlled exit.
And then a sixth thing, which isn't a question: write down which branch you took and why, before you know how it ends. Memory edits itself in the direction of whatever happened. A dated record of the reasoning is the only way to find out later whether this framework is working for you or just comforting you.
What "hold" has to earn
Notice that hold isn't the passive branch — it's the most aggressive one on the board. It's the only branch with a real upside (+$2,261.85 on a 5% rally), the only one exposed to the full downside (-$2,657.23), and the one you'll end up in by accident if you answer "not sure" and close the laptop.
That's the trap this framework exists to catch. Holding because you looked at the 59% and decided the odds justify the risk is a decision. Holding because you couldn't face the other two is the same position with none of the thinking — and the stress table can't tell the difference, but your account will.
Compare branches, not feelings
Every number here came from pricing three complete positions under identical assumptions and shocking them the same way. That's the entire trick, and it's mechanical — which means it's exactly what software should be doing while you're deciding, rather than what you should be doing from memory at 3:58pm with your strike in the money.
Building that comparison — your actual position, the candidate roll, the close, side by side across price, time and volatility — is what Risk Illustrator's Decide tab is for. Model the decision, not just the trade.
All figures are model values under flat volatility for illustration — live markets add skew, spread, and assignment considerations. Nothing here is investment advice.